The work of the Court in 2018–19
The outcome of the Family Court of Australia (Family Court) is to:
Apply and uphold the rule of law for litigants in the Family Court of Australia through the resolution of family law matters according to law, particularly more complex family law matters, and through the effective management of the administrative affairs of the Court.
The Court has three targets under timely completion of cases:
- Clearance rate of 100 per cent
- 75 per cent of judgments to be delivered within three months, and
- 75 per cent of cases pending conclusion to be less than 12 months old.
Snapshot of performance
| Target | Result 2018–19 | Target status |
|---|---|---|
| Clearance rate of 100 per cent | The clearance rate was 102 per cent | Target met |
| 75 per cent of judgments to be delivered within three months | 79 per cent of judgments were delivered within three months | Target met |
| 75 per cent of cases pending conclusion to be less than 12 months old | 62 per cent of cases pending conclusion were less than 12 months old | Target not met |
In 2018–19, the Family Court achieved two targets under timely completion of cases and was unable to achieve one. The annual performance statement for the Family Court is included as part of the Federal Court of Australia’s 2018–19 annual report.
Analysis of performance against purpose, 2018–19
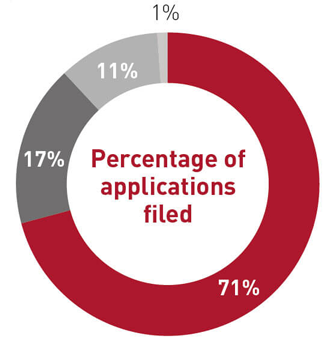
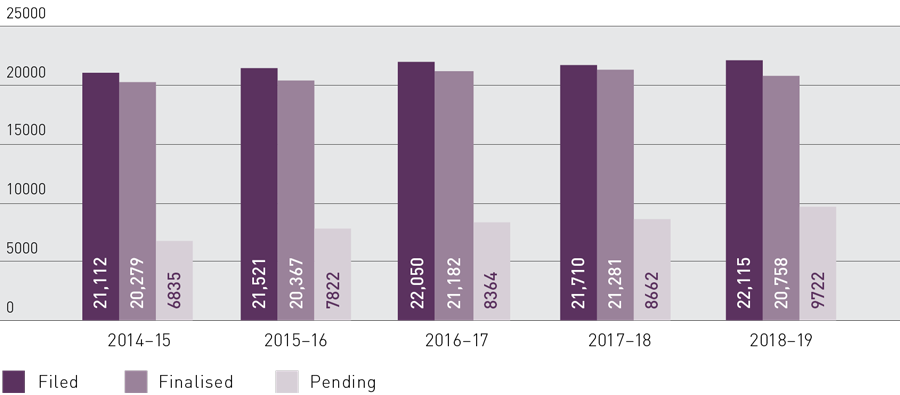
The Court deals with the most complex and difficult family law cases. Figure 3.1 and Figure 3.2 show a summary of original jurisdiction caseload during 2018–19.
The Court continually conducts data quality activities on its electronic case data. This is done to ensure that our case management system, as best as it can, reflects the information that is contained on the paper-based file.
Due to the complex nature of the data captured and the changing circumstances of the case, it is not unusual for data entries to be updated and refreshed. As a result of the activities in the past few years, the Court has decided to entirely refresh the historical data for the previous four years. This means that figures published in this report for historical years may not always be the same as those published in previous annual reports. Any changes in figures should be relatively insignificant.
|
Application/ case type |
Filed |
Finalised |
Pending |
|---|---|---|---|
|
Consent orders applications |
13,872 |
14,081 |
1375 |
|
Application in a case (interim) |
3236 |
3211 |
1672 |
|
Final orders applications |
2225 |
2395 |
2979 |
|
Other applications |
255 |
271 |
131 |
|
Total |
19,588 |
19,958 |
6157 |

|
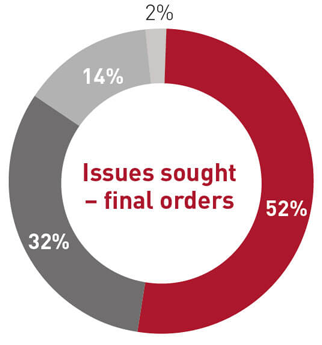
Issues sought on applications for final orders |
|
|---|---|
|
Financial only |
52% |
|
Parenting only |
32% |
|
Parenting and financial |
14% |
|
Other |
2% |

Case attrition
The Court’s cases are made up of complex matters that often involve multiple parenting or financial issues with high levels of conflict between the parties. This is reflected in the consistent percentage of cases proceeding to judgment. Figure 3.3 displays the five-year attrition and settlement trend in the Court’s caseload, and shows the stage reached by matters finalised in 2018–19, including the percentage that proceeded to judgment.

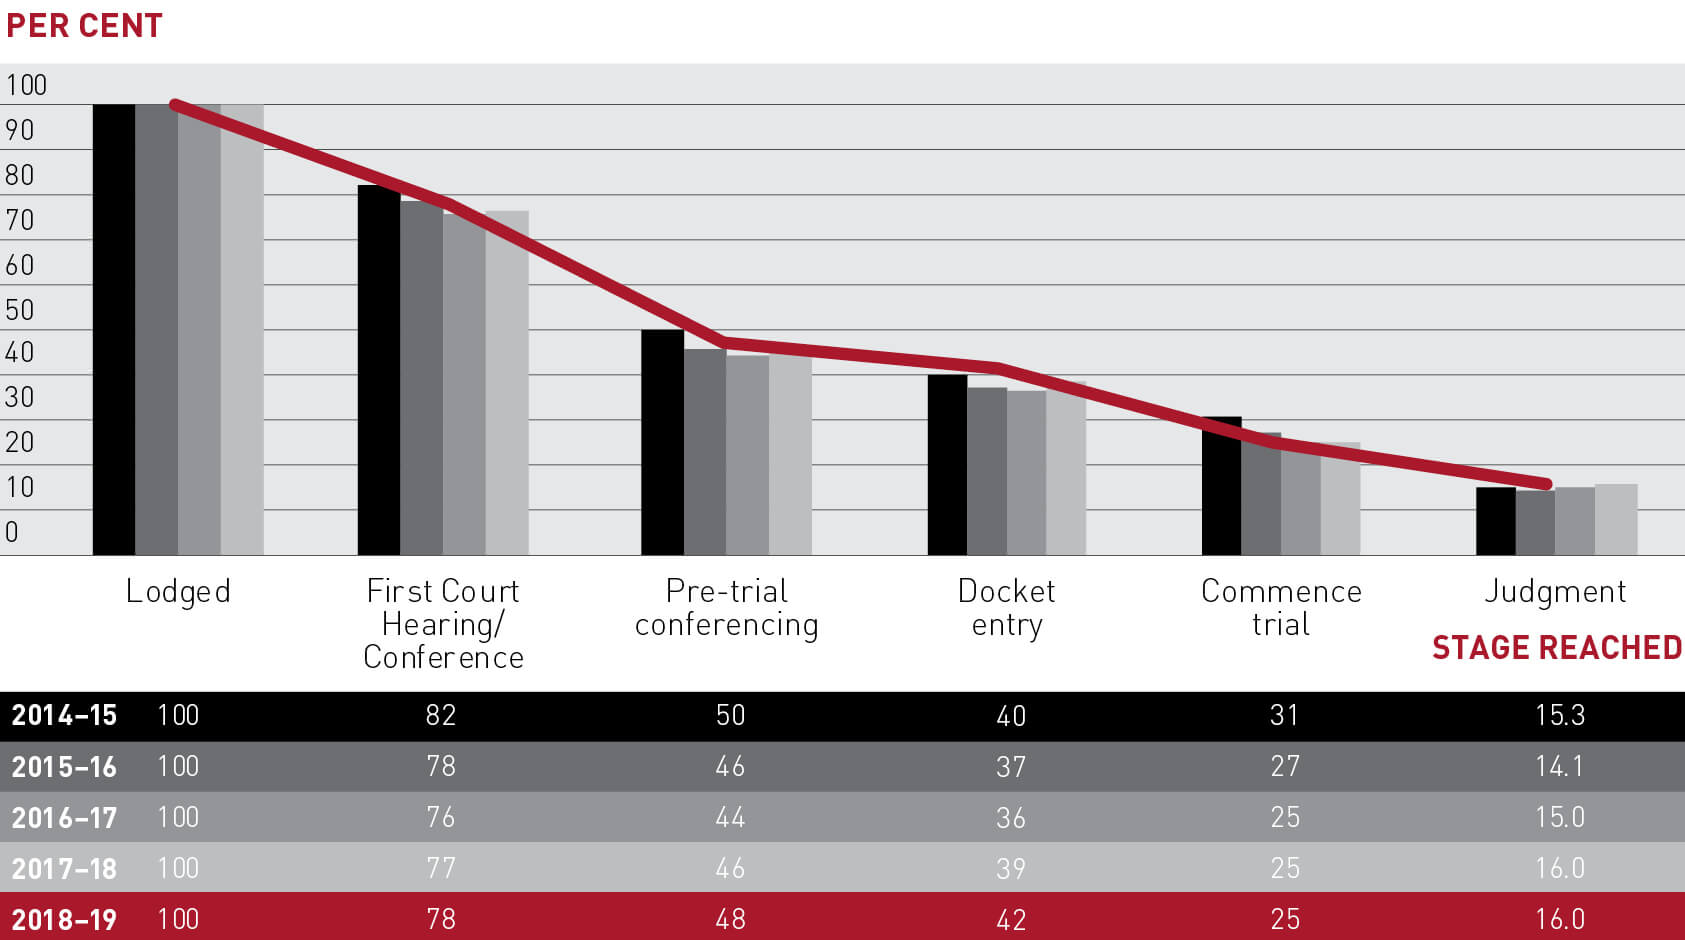
|
|
Lodged |
First Court |
Pre-trial |
Docket entry |
Commence trial |
Judgment |
|---|---|---|---|---|---|---|
|
2014-15 |
100 |
82 |
50 |
40 |
31 |
15.3 |
|
2015-16 |
100 |
78 |
46 |
37 |
27 |
14.1 |
|
2016-17 |
100 |
76 |
44 |
36 |
25 |
15.0 |
|
2017-18 |
100 |
77 |
46 |
39 |
25 |
16.0 |
|
2018-19 |
100 |
78 |
48 |
42 |
25 |
16.0 |
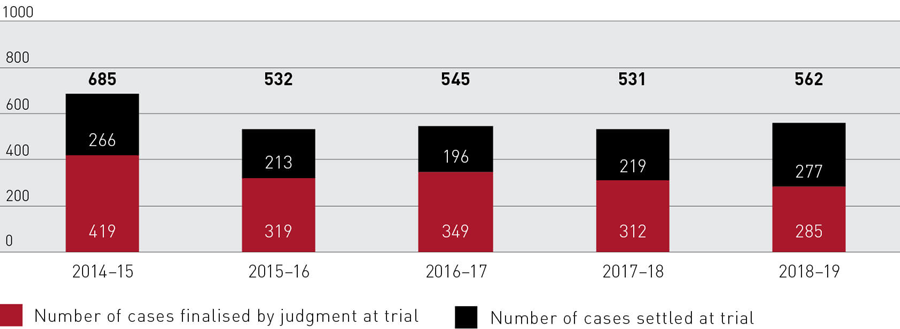
First instance trials
Parties who are unable to settle their dispute require a judge to make a decision after a trial, although frequently parties reach an agreement during the trial process. Figure 3.4 provides the number of cases that are finalised at first instance trial.

Number of finalisations
During 2018–19, the Court finalised the following matters in its original jurisdiction:
- 2395 final orders cases
- 3211 applications in a case (interim)
- 14,081 consent orders applications, and
- 271 other orders applications (including Hague, contempt and contravention applications).
Each application type requires a different amount of court resource effort to resolve. For example, final orders applications and associated interim applications require more judicial effort to resolve, whereas consent orders applications result from parties agreeing terms prior to filing and are considered by registrars.
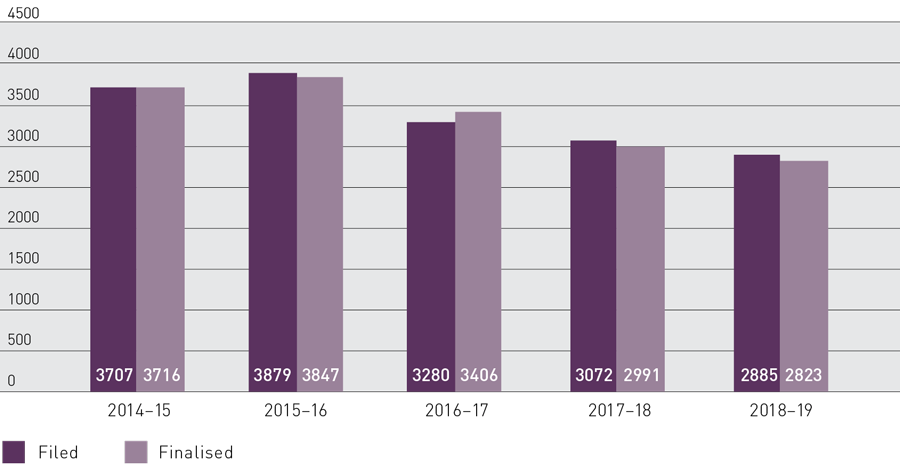
The Court also deals with discrete applications, such as contravention and contempt applications, and applications made pursuant to the Hague Convention on the Civil Aspects of International Child Abduction.
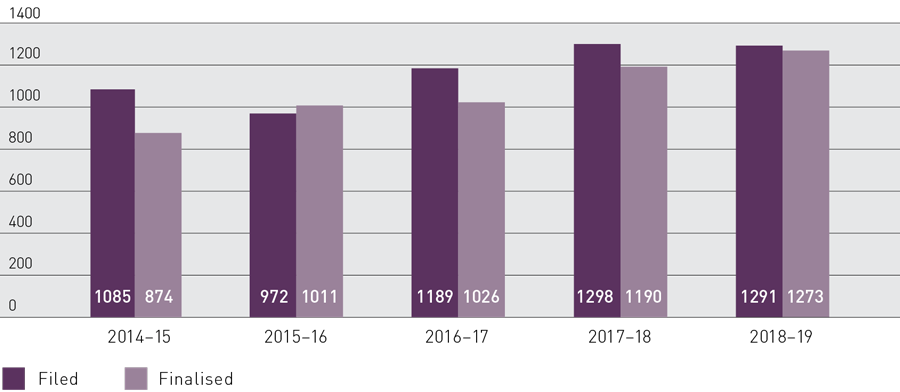
Final orders
During 2018–19, 2395 applications for final orders were finalised – a reduction of 5.5 per cent from 2017–18. While various factors can contribute to such a reduction, judicial availability and the complexity of matters have a significant impact. There is a continuing increase in the percentage of cases where there are allegations of child abuse or risk of child abuse, or family violence or risk of family violence involving a child or a member of the child’s family (see figures 3.18 and 3.19). Figure 3.5 displays the five-year trend in filings, finalisations and pending (active) final orders applications.

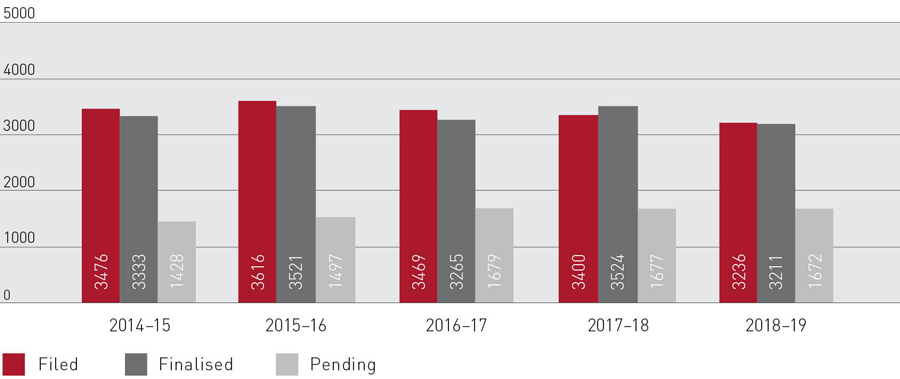
Applications in a case (interim applications)
Applications in a case (interim applications) are associated with an existing case. They can be complex and often there are multiple applications within one case. As shown in Figure 3.6, during 2018–19, 3211 applications in a case were finalised, a decrease of 8.9 per cent from 2017–18.

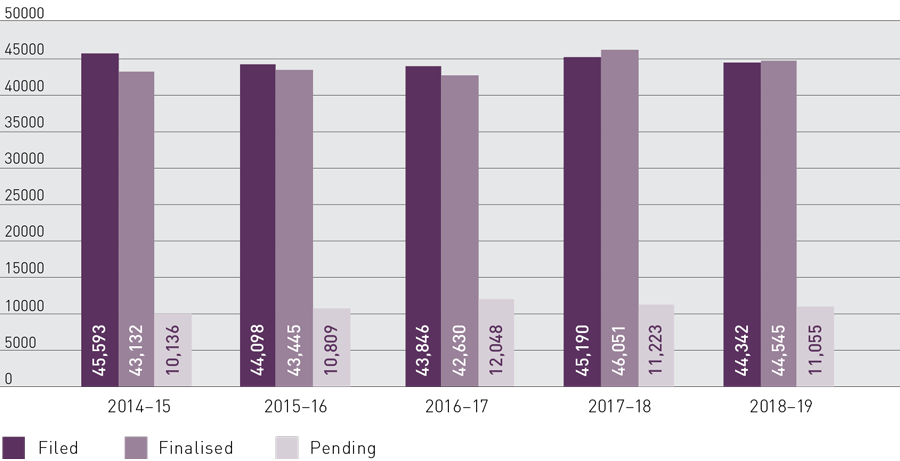
Consent orders
During 2018–19, 14,081 consent orders applications were finalised – an increase of 119 (0.9 per cent) since 2017–18. These applications vary in complexity and are presented to the Court as an agreement between the parties. The applications are considered by a registrar, and where appropriate orders are made encompassing that agreement.
Figure 3.7 to Figure 3.10 display five-year trends in filings, finalisations and pending (active) applications.


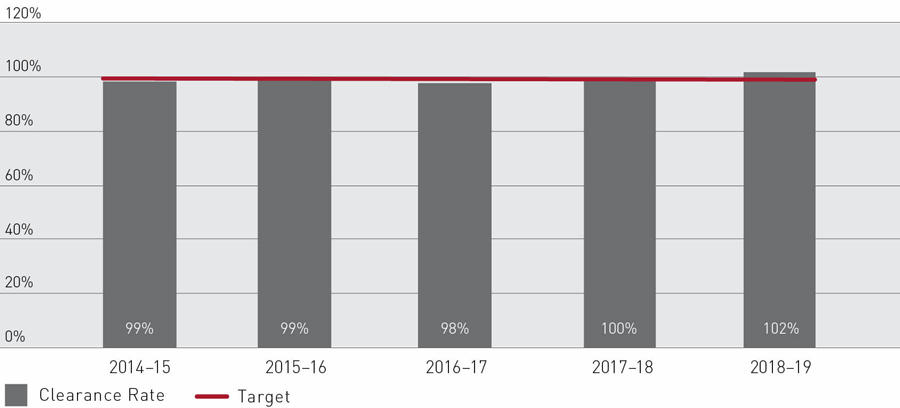
Clearance rate
The Court aims to finalise at least the same number of cases that start in a year and, as such, is attempting to achieve a clearance rate of at least 100 per cent. A clearance rate of 100 per cent or higher indicates that the Court is able to prevent an increase in its backlog of pending cases.
In 2018–19, the Court achieved a clearance rate of 102 per cent for all application types and 107.6 per cent for final order applications. Figure 3.9 shows the five-year trend in clearance rates.

Age of pending applications
The Court aims to have more than 75 per cent of its pending applications less than 12 months old. At 30 June 2019, 62 per cent of pending applications were less than 12 months old, compared with 67 per cent at 30 June 2018. The capacity to finalise some of the pending applications older than 12 months was impacted by judicial vacancies in 2018–19, particularly in the Melbourne and Sydney registries.
The Court regularly reviews its oldest active cases to better understand the causes of their delay and to determine ways in which the older cases can be managed. Figure 3.10 and Figure 3.11 show the five-year trend in the age distribution of applications.


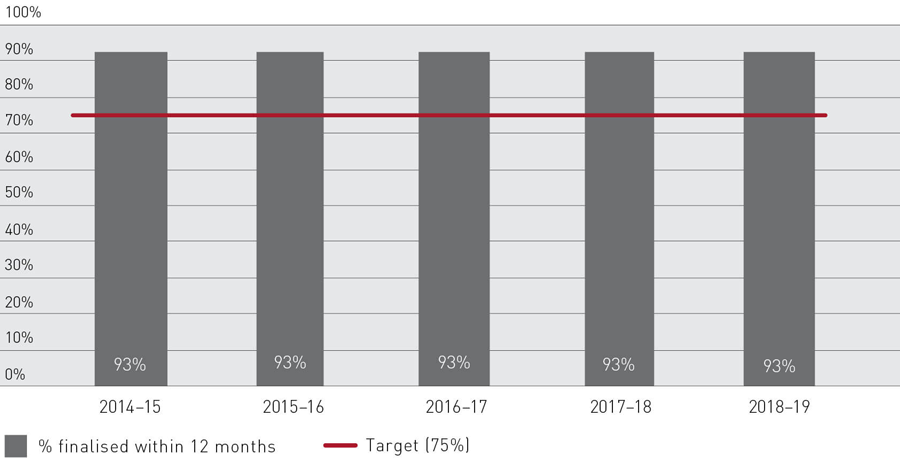
Age of finalised applications
The Court aims to finalise cases in a timely manner, but is mindful that family law cases are particularly difficult and emotional and the Family Court’s decisions affect many lives, potentially for many years. It is difficult to set and achieve a blanket timeliness target because the number of variables affecting the parties involved in each case has multiple impacts on its progress towards a decision. With this in mind, the Court aims to finalise 75 per cent of cases within 12 months. The other 25 per cent are the most complex cases.
In 2018–19, of the cases finalised by the Court, about 93 per cent were finalised within 12 months. Figure 3.12 and Figure 3.13 show the five-year trend in the age distribution of applications finalised.


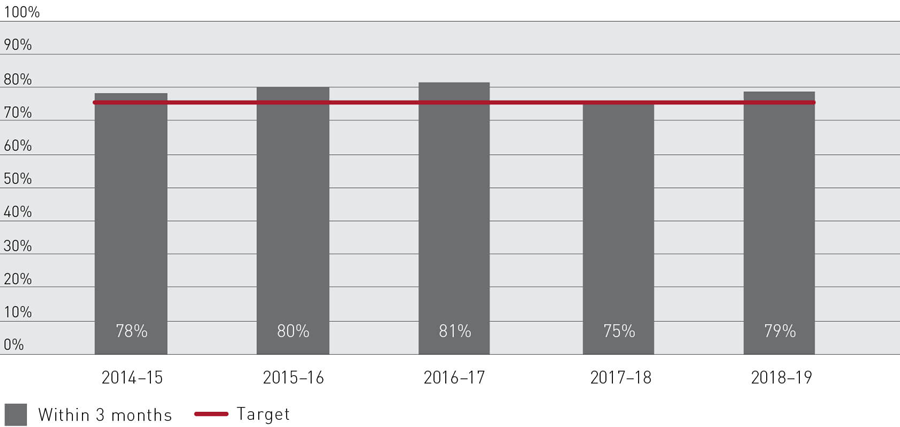
Age of reserved judgments delivered
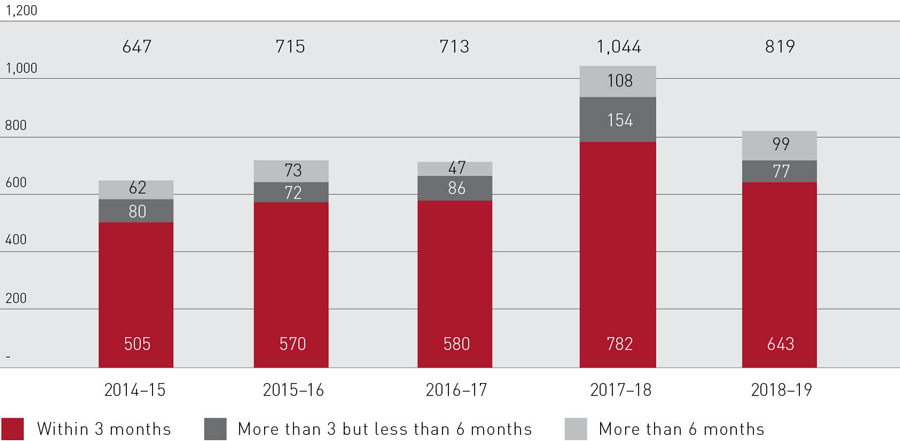
The Court aims to deliver 75 per cent of reserved judgments within three months of completion of a trial. In 2018–19, 643 (79 per cent) of the 819 reserved original jurisdiction judgments (excluding judgments on appeal cases) were delivered within that timeframe. Information on the performance of the Appeal Division can be found in Part 4 (Appeals) of this report.
Figure 3.14 shows the five-year trend of reserved judgments delivered within three months and Figure 3.15 shows the breakdown of time to deliver reserved judgments.


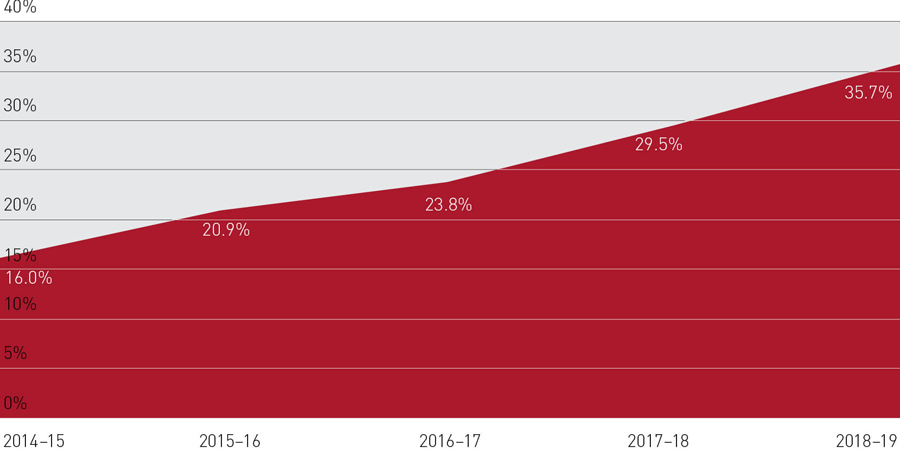
Unrepresented litigants
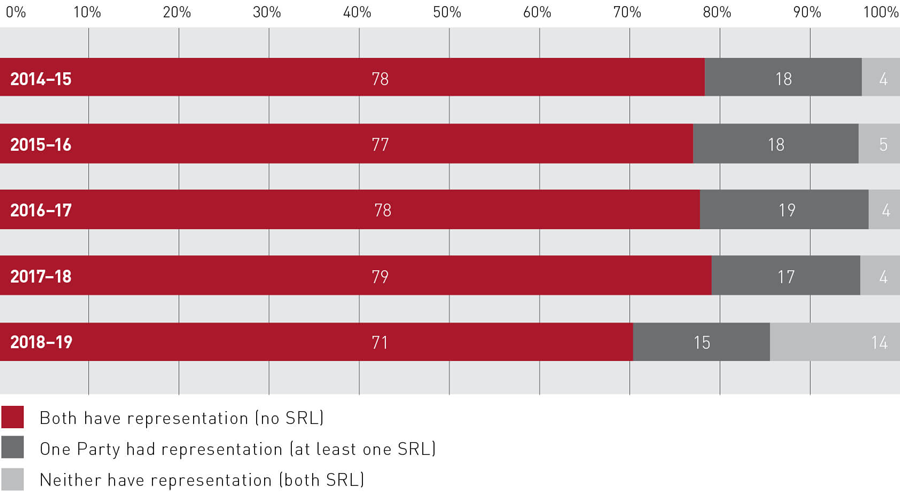
The Court monitors the proportion of unrepresented litigants as one measure of the complexity of its caseload. Unrepresented litigants present a layer of complexity because they need more assistance to navigate the Court system and require additional help and guidance to abide by the Family Law Rules and procedures.
Figure 3.16 shows litigants who had representation at some point in their proceedings and Figure 3.17 shows the proportion of litigants who had representation at the finalisation of their trial. There has been an increase in matters involving one or both parties not having representation at some point in their proceedings, from 21 per cent in 2017–18 to 29 per cent in 2018–19. There has also been an increase in trials where both parties are unrepresented from 8 per cent in 2017–18 to 22 per cent in 2018–19.
Note: The Court has revised its counting rule for these figures and as such the values in this section differ from those published in previous reports. The figures now exclude cases that did not have a first court event (i.e. withdrew or discontinued before appearing at court) and so they had not proceeded beyond filing. The information about legal representation in these cases was often incomplete as the parties had not provided this information at the time of filing.


Family violence and abuse (or risk)
Section 67Z and s 67ZBA of the Family Law Act 1975 and Part 2.3 of the Family Law Rules 2004 require a Notice of Child Abuse, Family Violence or Risk of Family Violence to be filed in cases in which it is alleged that a child to a proceeding has been abused or is at risk of abuse, or where there is an allegation of family violence or risk of family violence involving a child or a member of the child’s family. Once filed, the notice must be sent to a prescribed child welfare authority.
The proportion of matters in which a Notice of Child Abuse, Family Violence or Risk of Family Violence has been filed does not reflect all the cases in which family violence is raised or is an issue. Allegations of abuse or risk of abuse and family violence or risk of family violence are also raised by parties in other ways; for example, in affidavits filed in the proceedings and by the filing of a Family Violence Order (Rule 2.05 Family Law Rules 2004).
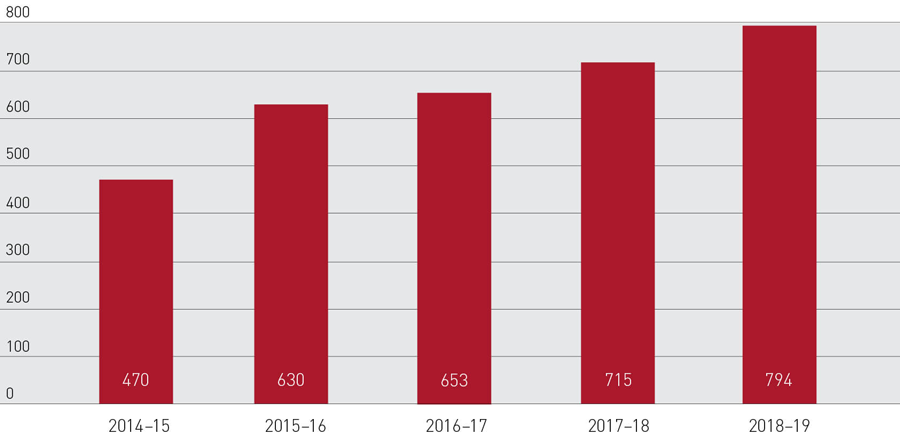
Figure 3.18 and Figure 3.19 show that in 2018–19, the number of Notices of Child Abuse, Family Violence or Risk of Family Violence filed continued to increase, adding workload to the Court. This reflects the growing awareness of family violence within the community and the need for litigants to raise family violence in conformity with the 2012 amendments. It also reflects the increasing complexity of the Court’s cases and the extent to which violence is an element in many of them.


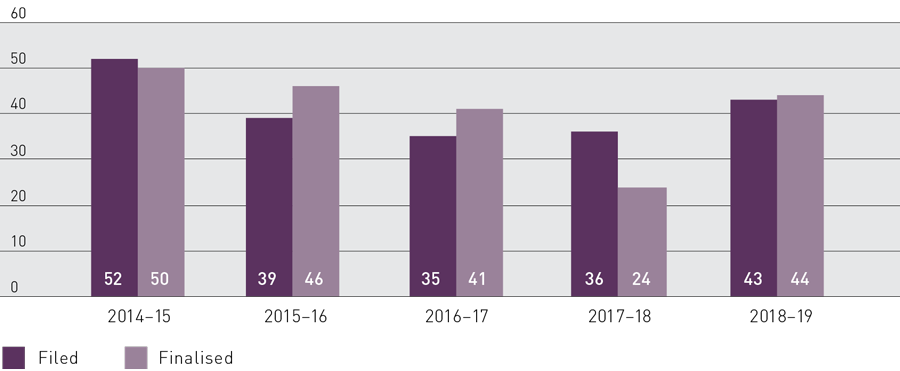
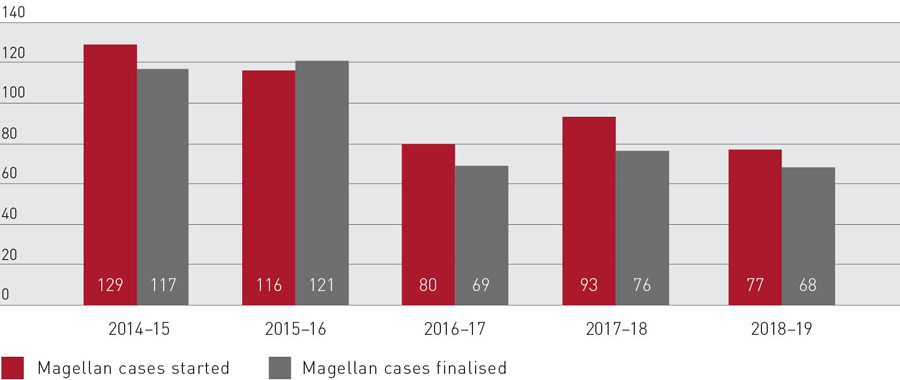
Magellan cases
Magellan cases involve serious allegations of physical abuse and/or sexual abuse of a child and undergo special case management. When a Magellan case is identified, it is managed by a small team consisting of a judge, a registrar and a family consultant. Magellan case management relies on collaborative and highly coordinated processes and procedures. A crucial aspect is strong interagency coordination, in particular with state and territory child protection agencies. This ensures that problems are dealt with efficiently and that high-quality information is shared. An independent children’s lawyer is appointed in every Magellan case.
Typically, a Magellan case is one where a notice of abuse or family violence is filed, although not all notices will necessarily result in the case being classified as a Magellan matter. The Court assesses and determines, from the issues raised, the matters that are managed under the Magellan program. Figure 3.20 details the number of Magellan cases commenced and finalised in the past five years.

National coverage as appellate court
Summary of appeal caseload
The Court’s Appeal Division deals with appeals including from decrees of the Family Court, the Family Court of Western Australia and the Federal Circuit Court of Australia. Table 3.1 summarises the appeals workload. More information can be found in Part 4 (Appeals) of this report on page 31.
|
|
2014–15 |
2015–16 |
2016–17 |
2017–18 |
2018–19 |
|---|---|---|---|---|---|
|
Appeals filed |
389 |
371 |
344 |
390 |
400 |
|
Appeals finalised |
356 |
354 |
377 |
370 |
379 |
|
Appeals pending |
289 |
270 |
208 |
220 |
224 |
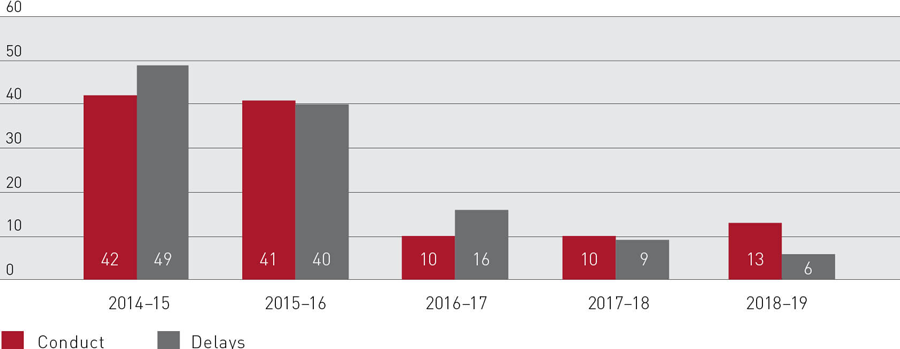
Judicial services complaints
Judges are accountable through the public nature of their work, the requirement that they give reasons for their decisions, and the scrutiny of their decisions on appeal.
Judicial services complaints are complaints about the conduct of judges or delays in the delivery of a judgment. These figures do not include complaints about registrars (these are included under ‘feedback and complaints management’ below). Complaints about judgments or orders can only be dealt with on appeal.
In 2018–19, the Court received 19 judicial services complaints, as follows:
- Judicial conduct – 13
- Delay in delivery of a judgment – 6
This represented 0.096 per cent of all applications filed (19,594), which is under the target of 1 per cent (when judicial complaints and administrative complaints are combined they total 0.163 per cent).
The number of judicial services complaints received by the Court in 2018–19 is shown in Figure 3.21, which also shows the breakdown between complaints about judicial conduct and complaints about delays.

Feedback and complaints management
The Family Court is committed to responding effectively to feedback and complaints. Comprehensive information about how to give feedback and lodge complaints is available on the Court’s website at www.familycourt.gov.au.
The judicial complaints procedure is also published on the website. That procedure is in line with the provisions inserted by the Courts Legislation Amendment (Judicial Complaints) Act 2012. It is also in line with the procedures of other federal courts.
The Court records all complaints made in relation to Family Court proceedings, although some complaints relate to services provided by the Federal Circuit Court, such as registry services and child dispute services, or other third parties.
In this reporting year, the Court received the following complaints:
Complaints about Family Court services
Administrative processes – 2
Conduct of registrars – 3
Privacy – 1
Total – 6
Complaints arising from services provided by the Federal Circuit Court or other third parties and relating to Family Court matters
Conduct of administrative staff – 2
Conduct of family consultants – 2
Family reports – 2
Total – 6
These figures do not include complaints about judicial outcomes, which can be dealt with through the appeal process; matters that are in other courts, such as the Family Court of Western Australia; or complaints about family law legislation, which is a matter for the Government.
The total number of complaints regarding Family Court matters (12) represented 0.06 per cent of all applications received. Combined with judicial complaints (19), the total number of complaints (31) represented 0.158 per cent of applications received, thus achieving the key performance indicator for complaints to be no more than 1 per cent of applications received.